Analysis Of The Correlation Of Defined Return Fund Returns With Equity Markets
INTRODUCTION
Defined return funds like the Levendi Thornbridge Defined Return Fund (the Fund) are designed to benefit from underwriting equity market risk and so harvesting the Equity Insurance Premium. They are being used increasingly by managers that are looking for liquid, alternative funds that can offer positive returns when the returns from other assets is low or negative. In this paper we look at the performance of a Proxy Index (the Index) calculated to represent the returns that defined return funds may have offered in the past and compare this with the returns from a basket of index tracking ETF’s. (the ETF’s)
THE PROXY INDEX
In order to illustrate the long term returns from a strategy that is like the Fund, we have developed a Proxy Index (the Index). The Index is combination of three parts; two parts that represent the returns from the investment strategy and a risk management overlay.
- The CBOE PUT Index; PUT is an index that measures the performance of a hypothetical portfolio that sells S&P 500 Index (SPX) put options against collateralized cash reserves held in a money market account. The daily historical data for the PUT Index extends back to June 30, 1986. The PUT strategy is designed to sell a sequence of one-month, at-the-money, S&P 500 Index puts and invest cash at one- and three-month Treasury Bill rates
- The Investment Product Research FTSE Autocall Index; this is an index calculated using the daily price of FTSE linked Autocalls. The change in the level of the index every day is equal to the average change in the price of each product in the index. Products will be included in the index if they are Autocalls linked to the FTSE where the price is published every day. They must have an annual or shorter frequency early maturity feature. At maturity the knock in put must have a barrier of 65% or less.
- A risk management overlay. The investment exposure is adjusted daily so that it is always lower than 10% divided by the realised volatility of the investments over the last twenty days. This process reduces the investment exposure when volatility is high.
The chart below shows the performance of the Index versus the total return from UK equities since 1990.
PROXY INDEX RETURN VERSUS UK EQUITY TOTAL RETURN

Source; Levendi Investment Management
CORRELATION WHEN IT MATTERS
Assets with lower or even negative correlation can offer significant advantages to investors. However, its important to be clear about how this should be measured and identified. Investors are more concerned about correlation over the medium term rather than on a day to day basis. The truly useful asset is one that offers a positive return when the return from other assets is low or negative and which does not act as too much of a drag when other returns are positive.
In order to illustrate the correlation, the chart below illustrates the rolling one-year return of an equally weighted basket of ETF’s tracking the FTSE 100 and Eurostoxx 50 and the Proxy Index
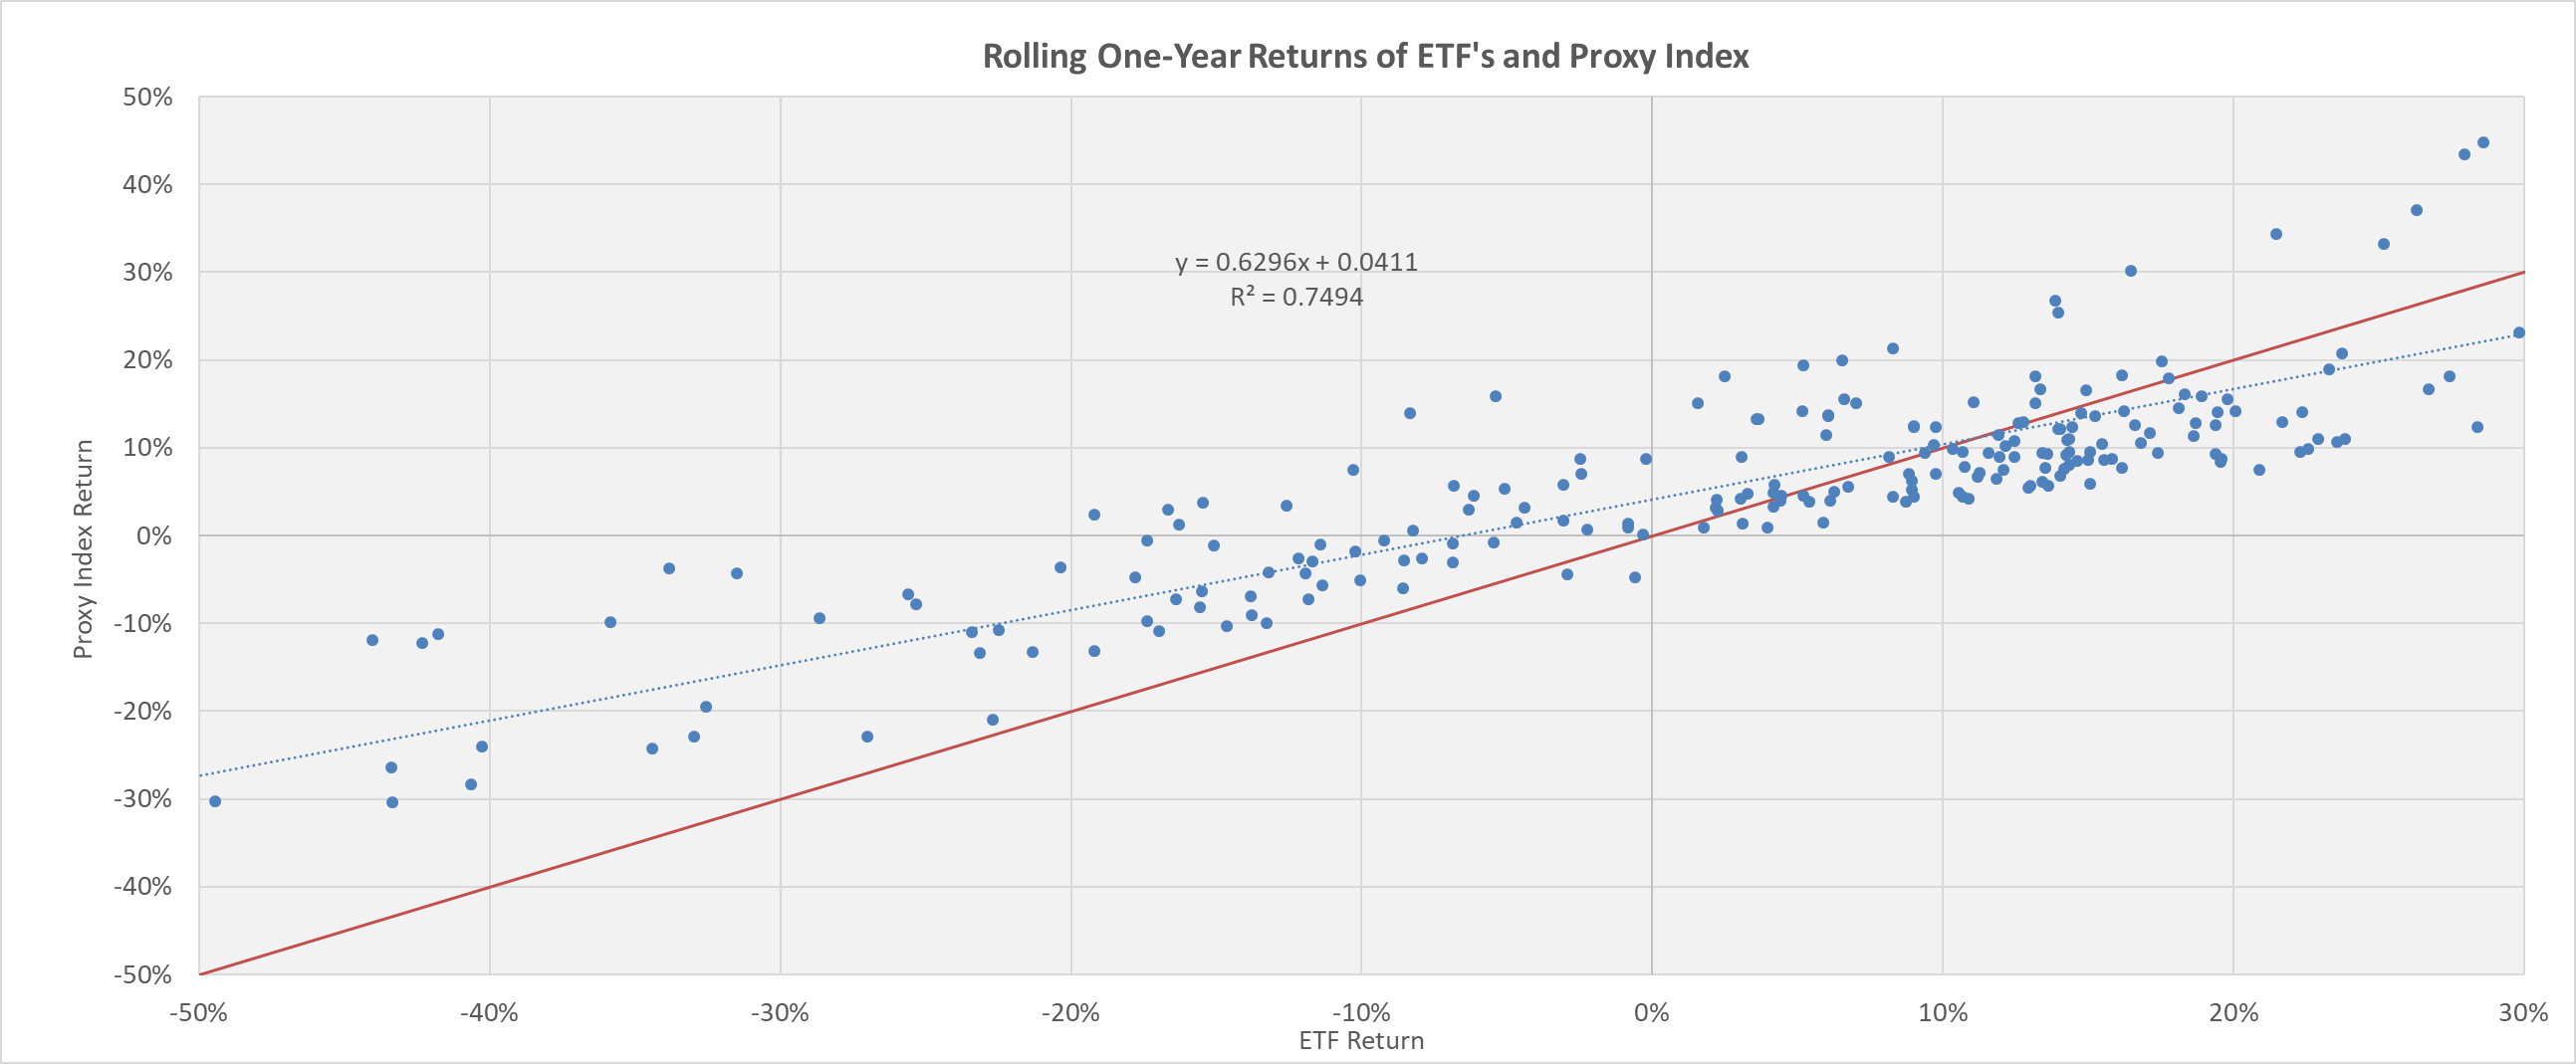
Source; Levendi Investment Management 1 August 2019
The chart above illustrates several attractive features of the performance of the Index.
- On average the Proxy Index offers positive excess returns (about 4%) when the annual return from the ETF’s are zero
- There are several instances in the top-left quadrant where the Proxy Index delivered positive returns when ETF returns are negative. This is the most attractive type of negative correlation.
- The proxy index returns are always better when the ETF returns are negative
- The Index returns have not been negative when the ETF returns are positive so avoiding the most unhelpful type of negative correlation
- All the points above the diagonal represent instances where the Index returns exceed the ETF returns
The nature of the return profile of the Index means that the Index benefits from a high positive carry. The Index is likely to offer better returns when the ETF returns are less than 10% per annum and less positive returns when the ETF Returns are more than 10%.
The return profile of the Index in normal market conditions is summarised in the chart below.
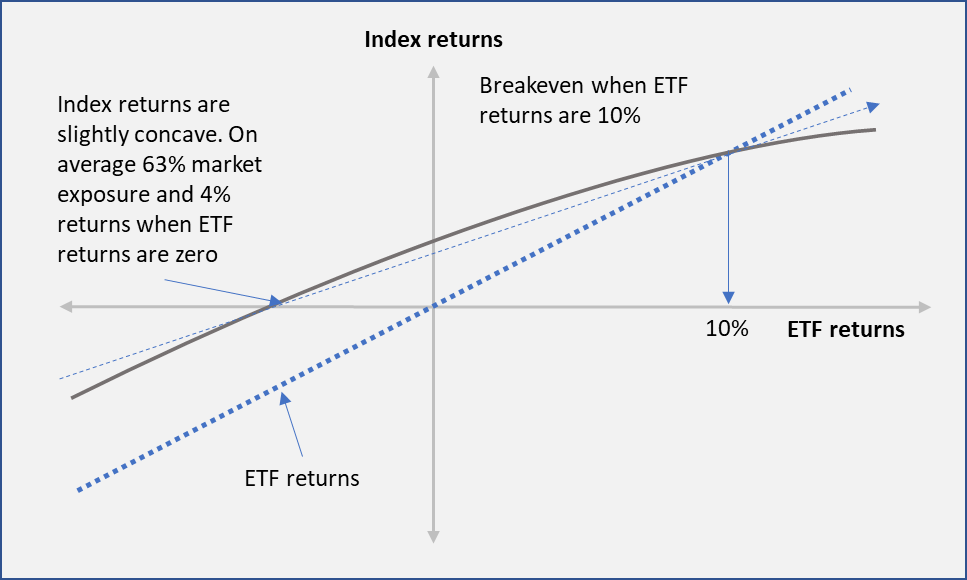
The relationship between the Index returns and the ETF returns is typical of the profile of individual covered call or covered put positions prior to maturity. By simplifying the relationship between the Index and the ETF’s it becomes easier to see how the returns differ and when the Index offers attractive correlation benefits.
Comparing the returns like this demonstrates the broad trade-off; investors in the Index accept that returns may be less than the equity market when equity returns are high in exchange for higher returns when the returns from the equity market are below average or negative.
The observations in the top-left quadrant represents attractive negative correlation. These are instances where the Index returns have been positive when the market returns have been negative. The absence of any instances in the bottom right quadrant highlight the low opportunity cost of using funds that have a similar profile to the index as a diversifying asset.
In the chart below we illustrate the performance of the Index and the ETF’s based on various return scenarios.

CONCLUSIONS
The analysis shows that the proxy strategy would have acted as an attractive diversifying asset when market returns are below average and would still offer a good return when market returns are more normal. However, investors must be comfortable with the potential for the fund to underperform when markets rise strongly, and for correlation to increase when markets fall significantly.
The results from our analysis are consistent with the results from numerous studies of the performance of CBOE PUT, the benchmark for covered put strategies.
DISCLAIMER
The contents of this document are communicated by, and the property of, Levendi Investment Management Ltd. Levendi Investment Management Limited Ltd is an appointed representative of Thornbridge Investment Management LLP which is authorised and regulated by the Financial Conduct Authority (“FCA”). The information and opinions contained in this document are subject to updating and verification and may be subject to amendment. No representation, warranty, or undertaking, express or limited, is given as to the accuracy or completeness of the information or opinions contained in this document by Levendi Investment Management Ltd or its directors. No liability is accepted by such persons for the accuracy or completeness of any information or opinions. As such, no reliance may be placed for any purpose on the information and opinions contained in this document. The information contained in this document is strictly confidential. The value of investments and any income generated may go down as well as up and is not guaranteed. Past performance is not necessarily a guide to future performance.
