Analysis of the Levendi Fund performance against the underlying market returns
LEVENDI – PERFORMING AS EXPECTED
In our main brochure one of the claims we make for the Fund is that it should outperform equity markets if markets fall, remain static or rise modestly. It’s only at the two extreme ends of the distribution of returns, when market returns are abnormally high, or when they are catastrophically bad that the performance of the Fund may not be better than the returns from the underlying equity markets. With twelve months of performance under our belt, we can start to examine this claim to see if it holds up.
Our analysis shows that;
- When we look at the performance over a short term (5-day) window we can observe that as expected, the fund has a low Beta (about 0.3) and a high correlation to underlying benchmark market returns.
- Using a 6-month observation period, the Fund retains a low beta and high correlation but significantly, the Fund offers positive returns when there is no or a low return from the market. From the data we have now, we estimate the Fund has offered an additional positive Carry of about 2.55% per annum.
- On the upside, an additional 2.55% positive Carry and an underlying market Beta of 30% means that market returns need to exceed 8% for the Fund to underperform its underlying market, and even then the underperformance is an opportunity cost.
- On the downside, the Fund return has been greater than the market return in every scenario where the market return is negative using both a 5-day and 6-month observation period.
SHORT TERM AND LONGER-TERM COMPARISONS
The last twelve months have been particularly testing, with two significant corrections in February and December dragging the total return for most equity market indices into negative territory for the year. Despite this, the Fund has offered a positive return over the 1st full year since we launched on the 31st January 2018. Compared to an equally weighted basket of FTSE 100 and Eurostoxx 50 Indices, the Fund outperformed by 11.95%.
To show how the Fund performs against its benchmark – the total return of an equally weighted basket of FTSE100 and Eurostoxx50, we analyse the percentage change in the value of the Fund versus the return from the underlying market over two separate time periods; 5 rolling days and 6 rolling months.
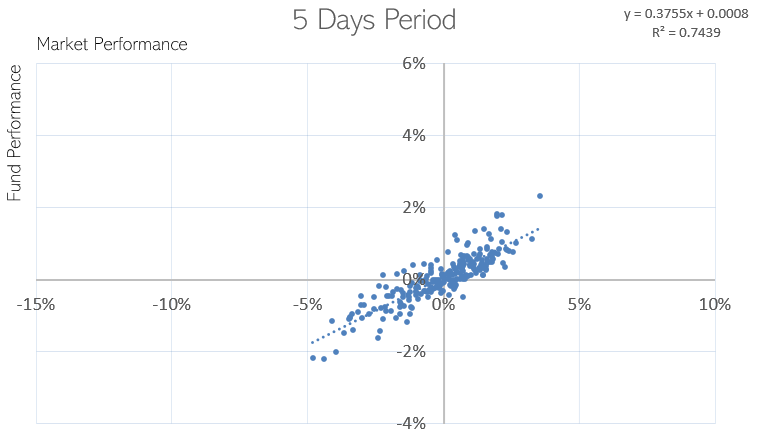
In the first chart below we compare the 5-day returns, considered a good measure of short-term returns. This shows the Fund has a low Beta and is highly correlated with the performance of the underlying market, as expected. Over the 1st year the Fund has had an average beta of 30%. Therefore a 1% move in the market would cause the value of the Fund to change by 0.3%. The intercept is close to zero as we would expect over a short period like this.
Chart 1; REGRESSION OF FIVE-DAY RETURNS
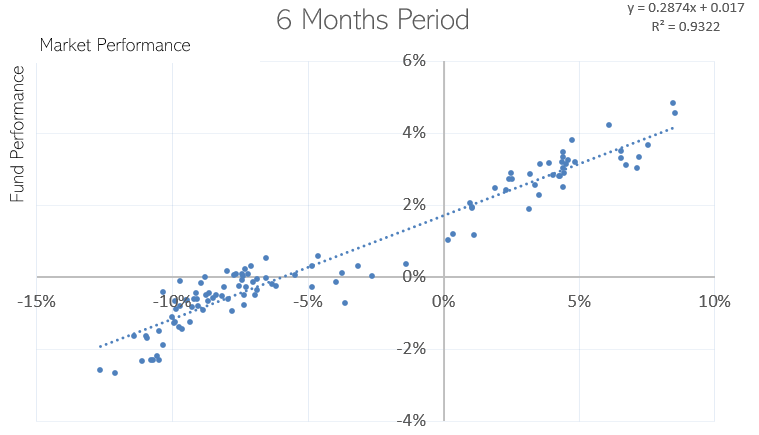
The second chart below shows the returns over a 6-month period. Extending the observation period like this starts to illustrate the differences between the performance of the Fund and the underlying equity markets. The Beta of the Fund is 28.74%, consequently a 1% change in the total return basket of indices will cause the value of the Fund to change by 0.2874%. However, the main difference is the positive carry the Fund can offer. This is the change in the value of the Fund when there has been no return from the underlying market. The chart shows the Fund has so far offered a realised positive return of 1.70% over a 6-month period when there has been no return from the underlying market. It is worth noting that since we are using the Total Return values of the indices, a zero return implies that there has been a fall in the levels of the Indices equal to the dividends received.
Chart 2; REGRESSION OF SIX-MONTH RETURNS
When we add a line that separates the points where the return from the Fund has been greater than the market return, we can see that:
- The Fund return has been greater than the market return when the market return is negative
- The Fund return has in this instance been positive when there has been no return from the market.
- The Fund return is only less than the market return when the rolling 6 months market total returns exceeds c. 8%.
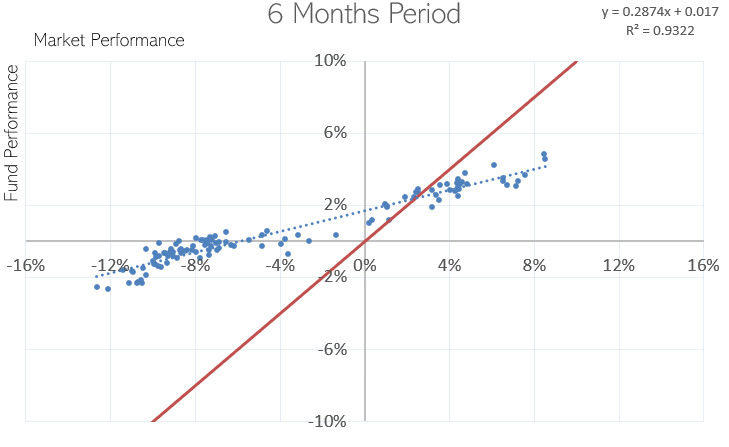
Red line represents the point where the return from the Fund has been greater than market return over a 6 months period, i.e blue points above the red line are instances the returns have been greater than the market.
CONCLUSIONS
The analysis of the Fund performance over the 1st year of trading has confirmed our expectations and how we described the Fund was expected to perform in our brochure. We can use this data to empirically model how the Fund has performed, although that is no guarantee it would perform similarly in the future.
CHART 4; MODEL OF FUND AND TRACKER RETURNS
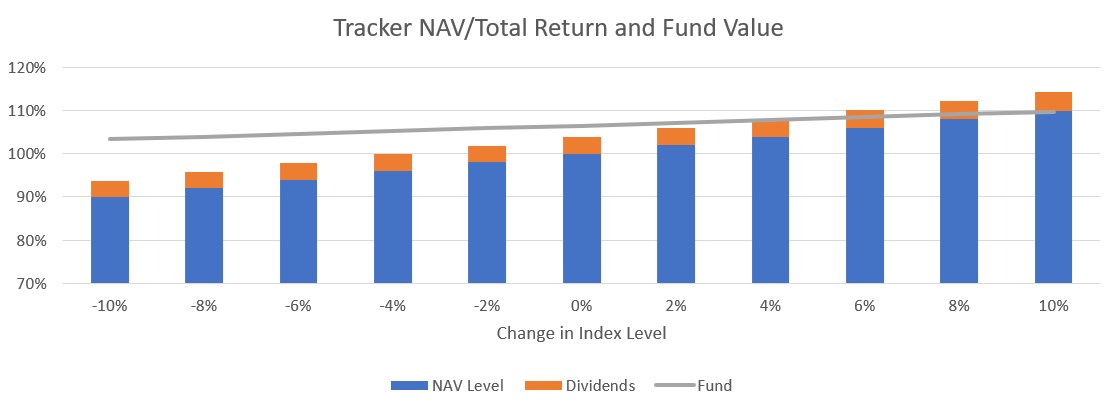
In this particular model the Fund value is estimated to be:
Fund Value = 100% + 35% of the change in the underlying indices level + Dividends + 2.55% Positive Carry
We have assumed that dividends are 4% and that they scale up and down with the level of the market. Dividends feed into the Fund performance through the pricing of the assets the Fund can buy. All else equal, a higher dividend yield increases the headline return.
We must conclude with a caveat. Any modelling like this is a derived estimate. There are multiple factors which have not been explored – e.g correlation, that can change and may influence the performance of the Fund. The Fund returns are not linear, the Beta will drop as markets rise and conversely increase when markets fall. To counter this, we have knowingly restricted the analysis to a relatively narrow range that reflects the range of market moves that we have seen over the last year.
Bearing the caveat in mind, this model reflects the way the Fund has performed over the 1st twelve months and offers an insight as to how the Fund may perform in the future based on how the underlying markets move.
- The Fund has generated a positive return despite significant falls in the level of equity market indices and negative total returns.
- If equity markets are unchanged, a tracker would offer a return of about 4%, if the Fund continues to perform as it has, the Fund would offer about 6.6%
- The upside breakeven – where the tracker Fund and Fund returns are the same is when total return markets rise about 8%, based on our above assumptions.
DISCLAIMER
The contents of this document are communicated by, and the property of, Levendi Investment Management Ltd. Levendi Investment Management Limited Ltd is an appointed representative of Thornbridge Investment Management LLP which is authorised and regulated by the Financial Conduct Authority (“FCA”). The information and opinions contained in this document are subject to updating and verification and may be subject to amendment. No representation, warranty, or undertaking, express or limited, is given as to the accuracy or completeness of the information or opinions contained in this document by Levendi Investment Management Ltd or its directors. No liability is accepted by such persons for the accuracy or completeness of any information or opinions. As such, no reliance may be placed for any purpose on the information and opinions contained in this document. The information contained in this document is strictly confidential. The value of investments and any income generated may go down as well as up and is not guaranteed. Past performance is not necessarily a guide to future performance.
