Defensive by Design
INTRODUCTION
The target market for the Levendi Thornbridge Defined Return Fund (the Fund) are investors who want an investment that has a high chance of offering a positive return with low volatility. These investors want a degree of protection when markets fall and have a low capacity for loss.
The Fund offers investors a way to get some equity market exposure with an element of protection. The headline objectives are to generate a LIBOR plus 6% return with less than 10% volatility. Within this overall objective the aim is to offer a positive return under most market conditions and to include a degree of protection when and if markets fall.
DEFENSIVE STRATEGIES
The management of the fund can’t eliminate risk, but the primary aim is to preserve the value in the medium term. To this end. there are three defensive strategies used that collectively help to reduce both the chance and the scale of losses that the fund may suffer and to control volatility. These are Product Design, Market Selection and the Risk Management Overlay.
ANALYSIS
Click on each of the headings below for more detailed analysis. This analysis demonstrates how effective each of the defensive strategies are, and how the product design features contributes to the overall defensive risk/return profile of the fund.
PRODUCT DESIGN
The fund only invests in very defensive assets that are designed to maximise the chance of a positive return and to minimise the chance and scale of losses. There are four product design features that are used with assets held by the fund;
- Progressive risk to capital rather than barriers to minimise the scale of losses
- Defensive hurdle to maximise the chance of a positive return
- Increased maximum term to increase chances of a positive return
- Significant safety margin to reduce the chance of losses.
PROGRESSIVE RISK
Most structured products offer “conditional” protection. Typically, the maturity value will be 100% unless the underlying asset has dropped below a barrier. If this condition is breached, the reduction in capital is some proportion of the fall in the underlying from the original level. Products that offer conditional protection can offer a high return and are a very effective way to minimise the chances of losses. But the problem is that once the barrier is breached the maturity value falls precipitously.
When designing assets for the fund we have a strong preference for products where the worst-case result is likely to be better than the return from a tracker fund. We prefer products where the capital return is progressive, we want to avoid steps or jumps in the maturity value. As a result, we typically invest in products that use vanilla European puts or put spreads.
To compare progressive risk products to barrier products we can look at the risk/return profile of two similar products and a FTSE tracker. The two products are shown below.
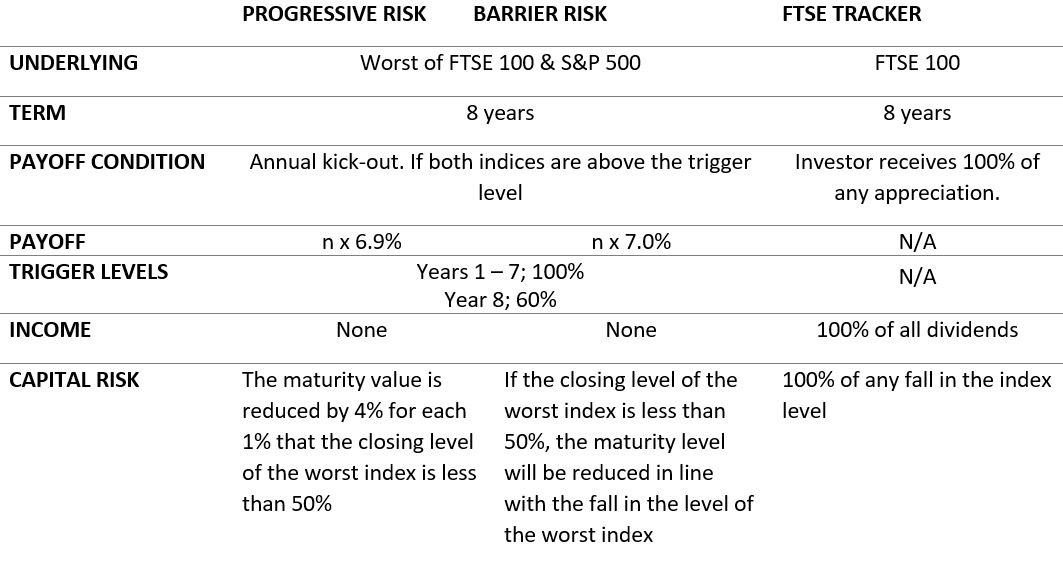
The headline return of the two defined return products is similar. They have the same kick-out schedule and the payoff is about the same. The headline coupon for the Progressive Product is 6.9% for each year compared to 7.0% for the Barrier Product.
When we look at the risk to capital of the two products, we can see that they are very different. The chart below shows the return profile of the two products and allows a simple visual comparison of the downside risk.
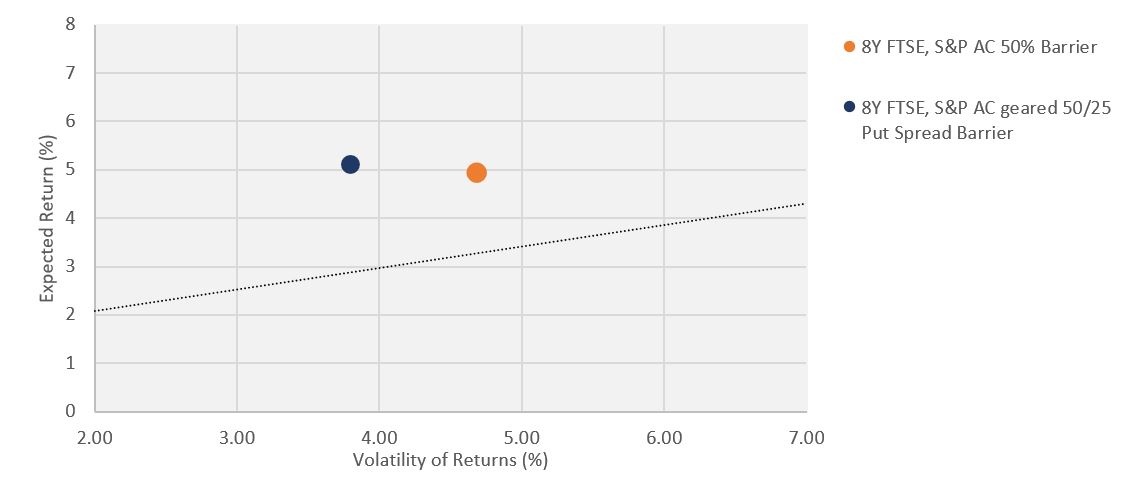
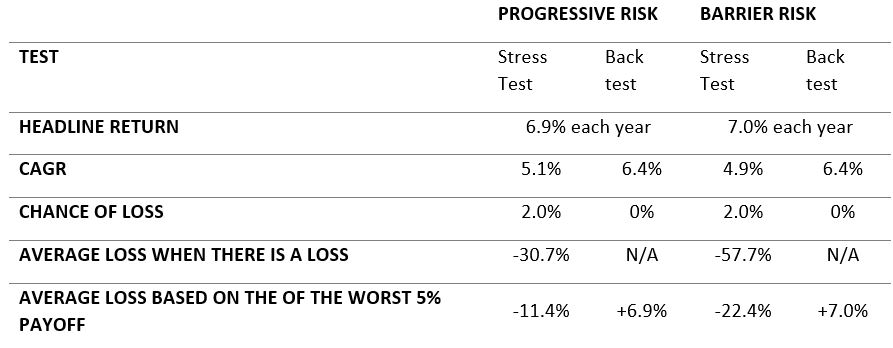
If we equate risk with the chance and scale of losses, it’s clear that the Progressive Risk product is significantly less risky. The following table compares the stress test and historic back-test results for each product.
Source: Levendi-IM
The analysis illustrates the contrast between the Progressive Risk and Barrier Risk products:
- The chance of loss is the same because the barrier and put strikes are the same (50%). The chance of loss for both is 2% in the stress test and 0% based on the back-test. (The stress test results typically indicate a higher chance of loss than the backtest.)
- In the case of the stress test, when there is a loss, the loss on the Progressive Risk product is much less than the loss on the barrier product. This is known as the Conditional Loss.
- For a combination of FTSE and S&P there are no instances of loss in the back test. In every case the product would have matured at 100% or more. However, if we look at a combination of FTSE and Eurostoxx there have been instances where there has been a loss. For this combination of underlying assets, the difference in the historic back test is particularly noticeable. An 8-year term means that the worst case would look at the period from the Dot-Com peak in Jan 2000 to the depths of the financial crisis on Dec 2008. In this case the Progressive Risk product would have lost 11.9% whereas the barrier product would have lost 53%.
- Calculating a loss based on the worst 5% of results is a broadly accepted way to estimate a “worst case” result. The loss using this measure is much lower for the Progressive Risk product in the stress test and back test. For the back-test, this measure of “worst case” is positive because the worst 5% includes some instances where the product has redeemed at 100% and some where the return is positive.
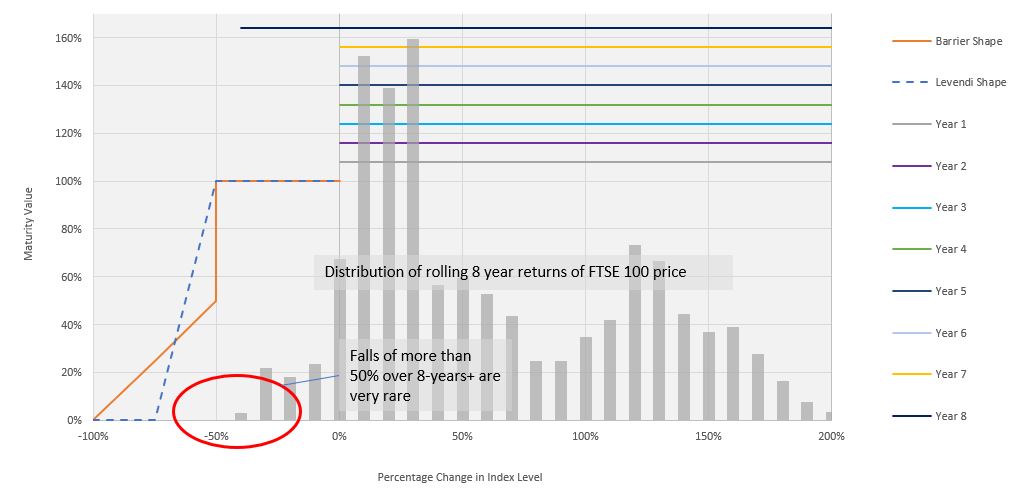
The other perspective that is useful is to overlay a histogram of the eight year returns of the FTSE onto the payoff chart. This illustrates how the differences in payoff occur at the extreme left-hand end of the distribution of returns. This suggests that it is very unlikely that the index will fall by more than 50% over an eight-year period, and when this happens the fall is likely to be only a few percentage points worse.
LONGER TERM PRODUCTS
Imagine that, as an investor in an Autocall, you are at the end of the maximum term. The conditions for the product to kick-out have not been met, or that the level of the worst index was below the capital protection level. If you had the option to extend the term for an additional year or two would you accept? The answer for most investors is that they would accept the extension.
Extending the term of the investments from the standard 6-years, to 8-years typically improves the risk/return profile. The longer term generally gives an up-tick in the payoff that we may receive and means that if the note has not matured early, there are more opportunities for the note to offer a positive return and for the indices to close above the capital protection level. Our analysis shows that extending the term of an Autocall offers better returns without any material increase in risk.
The following table shows indicative terms for a 6-year and an 8-year Autocall with summary analysis from our stress test. The benefit of the longer term is that coupon for the longer-term product is, in this case significantly higher.
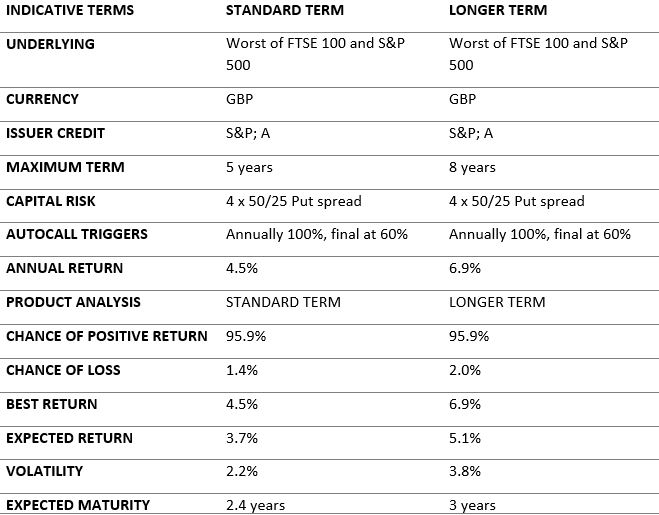
Source: Levendi-IM
DEFENSIVE TRIGGERS
We have a strong preference for “defensive” products that will offer a positive return even when the underlying market falls. The defensive moniker is commonly applied to products where the Autocall trigger is below the current index level. Typically, the products we buy will offer a positive return even if the underlying markets fall by 40%.
The table below shows the probabilities of a FTSE / S&P 500 Autocall kicking out. The kick out levels are 100% every year aside from the final year, when the kick out level is reduced to 60%. The defensive final trigger has a significant effect and materially increases the chance that the products offers a positive return.
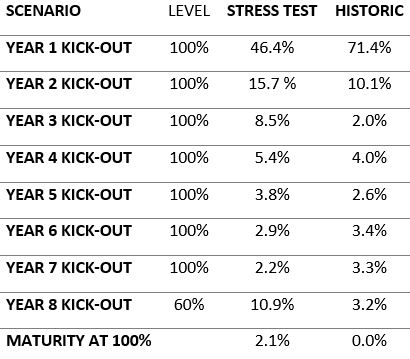
Source: Levendi-IM / Bloomberg. Back test data from 31 Dec 1993.
If the final trigger was at 100% rather than 60%, the annual return would increase to 11.2%. However, the chance of receiving a positive return would drop from 95.9% to 86.9%. The chance of no return over the full term increases to 11.1% and the chance of loss remains the same at 2.1%.
PUT STRIKE
We are very careful where we set the index levels at which the final value of an investment may be less than 100%. Because we aim to minimise the chance of loss the capital return safety margin is typically 50%. This means that the level of the underlying index, or indices referenced by an investment would need to fall by more than half before the capital value was reduced.
The chart below shows the level of the FTSE 100, S&P 500 and Eurostoxx 50 rebased so that the last value is 100. The chart illustrates that a 50% fall from the current levels would take both the FTSE and Eurostoxx to the lows that were reached at the depths of the financial crisis and the dot-com crash.
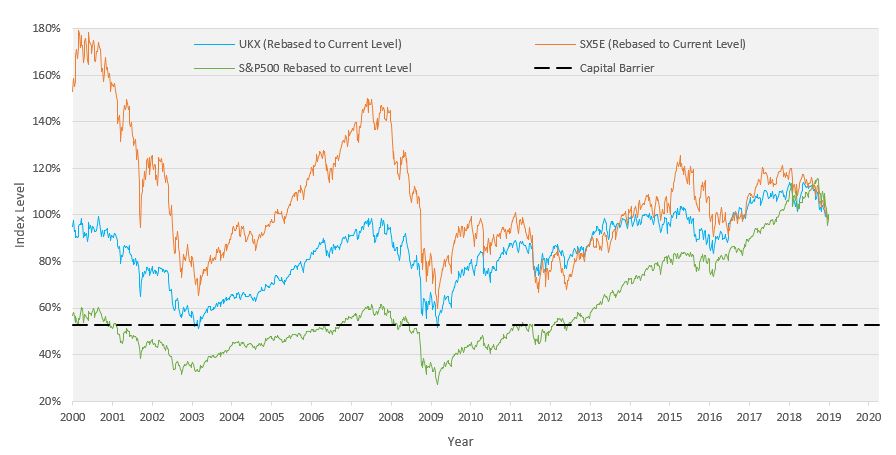
Source: Bloomberg
There are two main considerations we bear in mind when setting the put strike for any investment. We would like the strike to be below the ten-year low and the lows of the financial crisis and the dot-com crash.
In time the financial crisis will become less relevant and the low of the last ten years will be more salient. In broad terms, we are looking to set the put strike below a level which we think will be sufficiently low to cause central banks and governments to take action to support markets.
MARKET SELECTION
The choice of underlying markets for the investments held by the fund is a core part of the defensive strategy. We don’t need to pick the best performing markets; we simply need to avoid markets that fall significantly. Our primary consideration is to avoid markets where we think that there is a possibility that there may be a significant, protracted fall in the level of the index.
Although the fund is an equity-based fund, the investment approach is more like a bond investor with a strong value-based approach;
- We prefer mainstream equity market indices where there are deep and liquid markets. The liquidity of the assets we hold reflects the underlying liquidity of the equity derivative markets linked to the indices we use.
- We have a “value” orientation and so favour markets on lower PE multiples, reasonable and sustainable dividends and other characteristics that will provide support for the level of the index.
- High sustainable dividends are particularly attractive for two reasons. Firstly, the payoff of assets linked to underlying indices with high yields is typically higher than the payoff of assets linked to lower yielding indices. Secondly, in a very low rate environment, a high, sustainable yield provides some support for the level of the index.
- We tend to avoid markets that have had a rapid increase in value recently. We have a strong preference for products that offer capital protection unless the market falls below the lowest levels for the last 10 years. This means that we like the capital protection levels to be around the lows recorded at the end of the 2007-2008 financial crisis.
The following table shows some of the data from Bloomberg we consider when selecting the underlying markets for the main equity market indices.
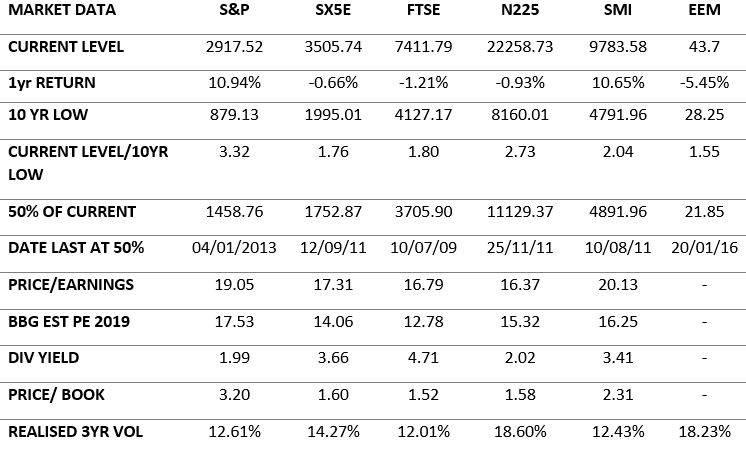
Source: Bloomberg
RISK MANAGEMENT OVERLAY
A key element of the design of the fund is that the volatility of the fund should be kept within a level that is acceptable for a lower risk investor. Ideally the risk/return profile of the fund should be relatively stable over time.
We expect that the realised volatility of the fund will be between 4% and 6% under normal market conditions. The risk management overlay will be used to prevent the volatility of the fund exceeding 10%.
There are several factors that will cause the volatility of the fund to fluctuate, but by far the dominant influence is changes in the level of the underlying equity market indices. This factor is so dominant that for all practical purposes the volatility of the fund can be approximated by multiplying the volatility of the underlying markets by the beta of the fund (the beta is the amount that the NAV of the fund will move if there is a 1% change in the level of the underlying markets).
CONTROLLING VOLATILITY
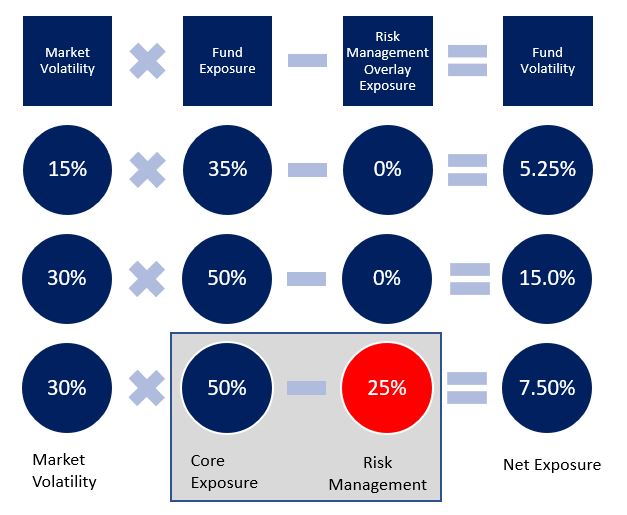
The primary way that keep volatility below the target is through the design of the assets we hold in the fund. As described above, the fund holds very defensive assets. These assets held have a low level of exposure to changes in the underlying market. As a rule of thumb the fund has about 35% exposure to the underlying market. So, if market volatility is about 15% this means that the fund volatility will be about 4.5%. (35% beta x 15% market volatility = 5.25% fund volatility).
However, as market conditions change, we can expect that market volatility will change and so will the beta of the assets we hold. If there is a large fall in the level of equity markets it is reasonable to think that market volatility will increase and the beta of the assets we hold will increase at the same time. This may mean that if we did nothing, the volatility of the fund would increase above 10%.
For example, if market volatility increased to 30% and our beta increased to 50%, the volatility of the fund would increase to 15%.
We can control volatility by selling assets we hold. We may at the same time reinvest in assets that have a lower beta, but this can incur costs that we would rather avoid. A quicker, cheaper and effective way to control volatility is to reduce our market exposure directly using our risk management overlay. In this case we could use futures contracts to reduce our market exposure. In the example above, if market volatility is expected to remain at 30%, we would need to reduce our beta back to 33% from 50%. This can be achieved easily and at very little cost by selling futures. (33% beta x 30% market volatility = 10% fund volatility).]
The below graphic is taken from our fund presentation which you can view here. It illustrates how the fund volatility can increase as markets fall and how the risk management overlay helps to dampen these effects.
The efficiency of the risk management overlay can be demonstrated by the table below. In this study we have used a long-term proxy for structured product returns. The table shows the characteristics of the proxy on its own, and then if we apply a risk management overlay. In addition, the table shows the same values for FTSE Total Return, and index that includes dividends.
This study demonstrates that the risk management overlay is an effective way to control volatility. It also helps to reduce losses as illustrated by the lower maximum drawdown.
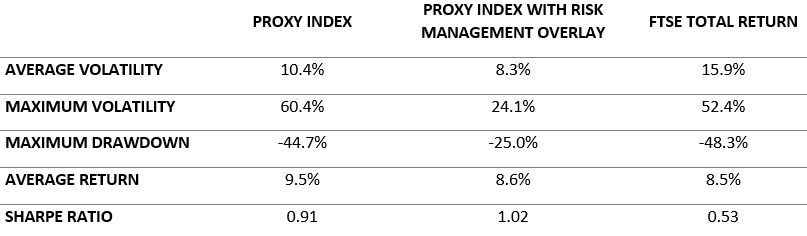
Source: Levendi-IM. The study uses data from September 2018. Volatility is annualised 100-day vol.
- The average volatility is below the target level
- It is impossible to completely control volatility, but the maximum volatility is significantly lower than the maximum volatility of the unhedged index
- The maximum drawdown is significantly reduced
- The average return is reduced but the Sharpe ratio of the hedged index is higher than the unhedged index and both are much higher than FTSE Total Return
DISCLAIMER
The contents of this document are communicated by, and the property of, Levendi Investment Management Ltd. Levendi Investment Management Limited Ltd is an appointed representative of Thornbridge Investment Management LLP which is authorised and regulated by the Financial Conduct Authority (“FCA”). The information and opinions contained in this document are subject to updating and verification and may be subject to amendment. No representation, warranty, or undertaking, express or limited, is given as to the accuracy or completeness of the information or opinions contained in this document by Levendi Investment Management Ltd or its directors. No liability is accepted by such persons for the accuracy or completeness of any information or opinions. As such, no reliance may be placed for any purpose on the information and opinions contained in this document. The information contained in this document is strictly confidential. The value of investments and any income generated may go down as well as up and is not guaranteed. Past performance is not necessarily a guide to future performance.
