Four charts – the Levendi risk/return story
Here are four charts which we think illustrate the risk/return story of the Fund.
RETURN
This chart has been lifted from Trustnet using their data. It compares our returns with the two sectors where the fund is used; Defensive Equity and Absolute Return.
Not much needs to be said here – we are delivering on our mandate.
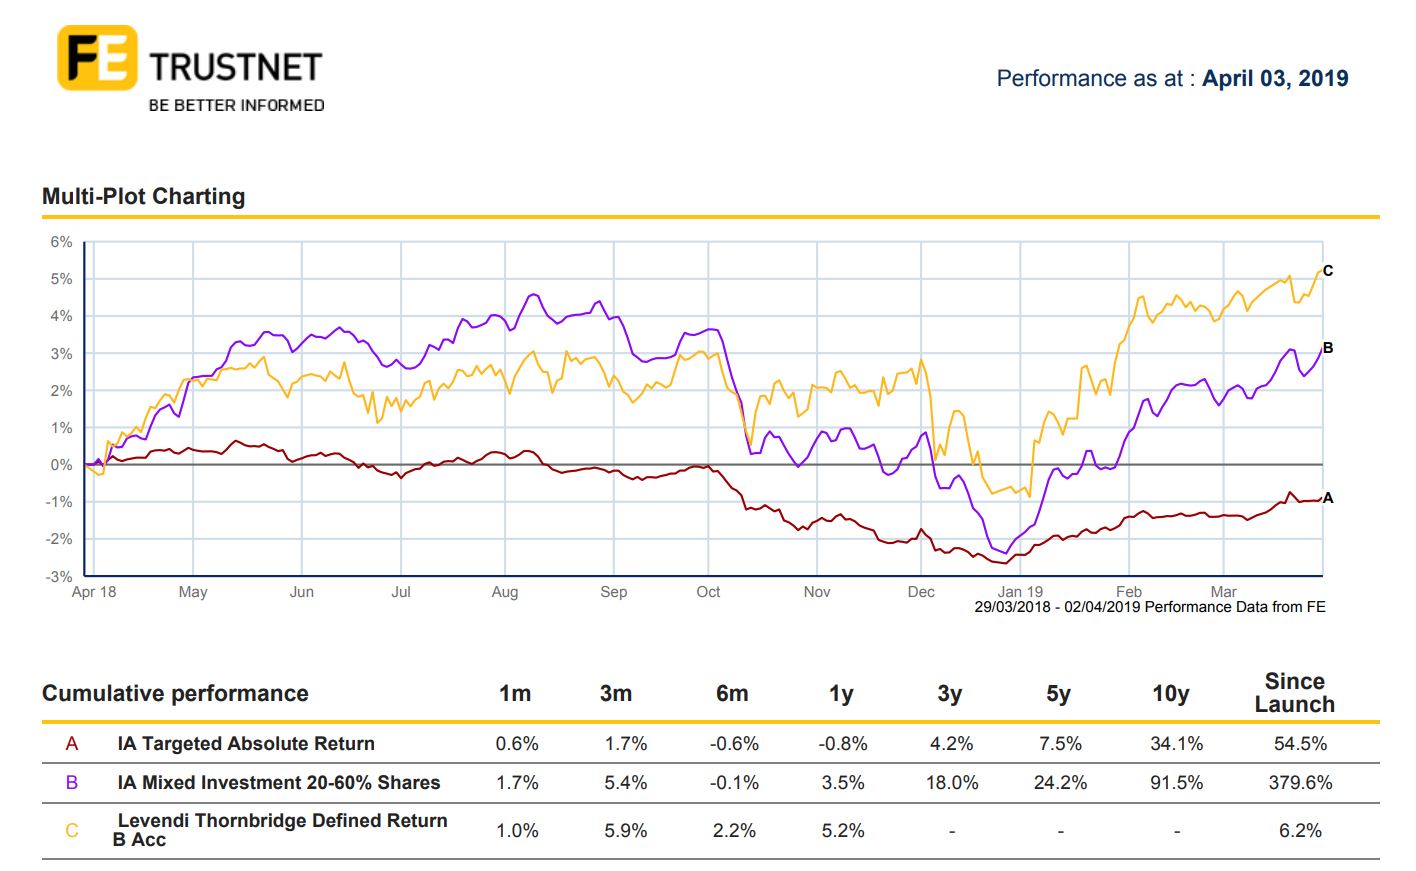
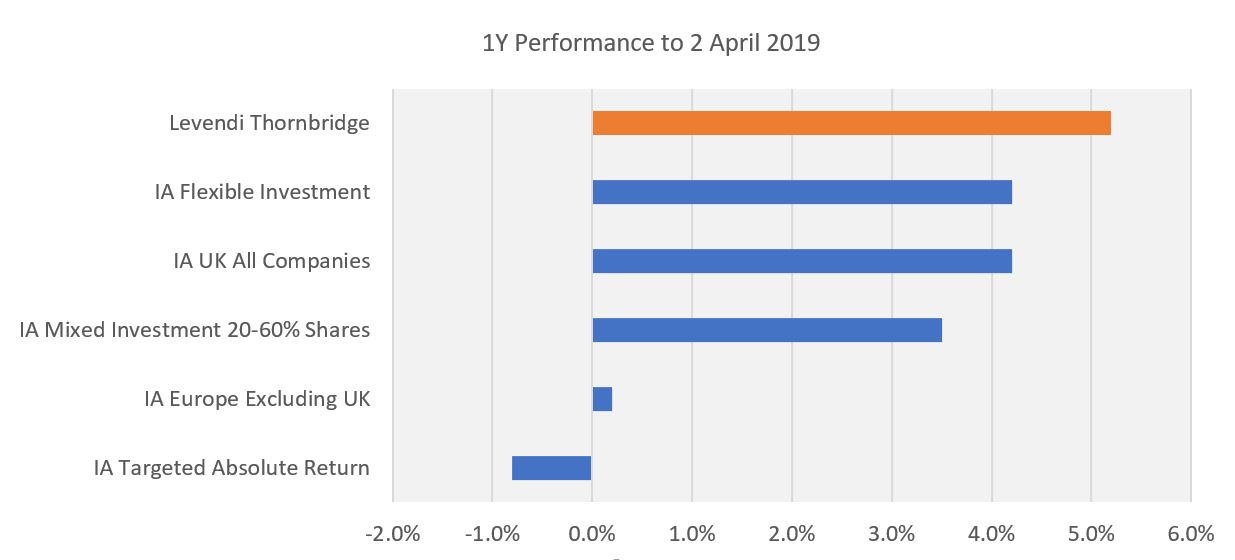
We can extend this analysis across more sectors – the story remains the same.
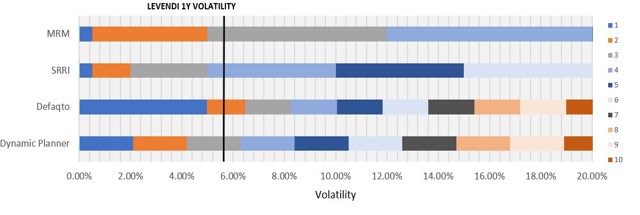
RISK
Equally as important is risk. Fund volatility sits around 5.5%.
Although not officially risk rated despite investor demand we can use the below to illustrate where the fund would sit on the Defaqto and Dynamic Planner risk scales.
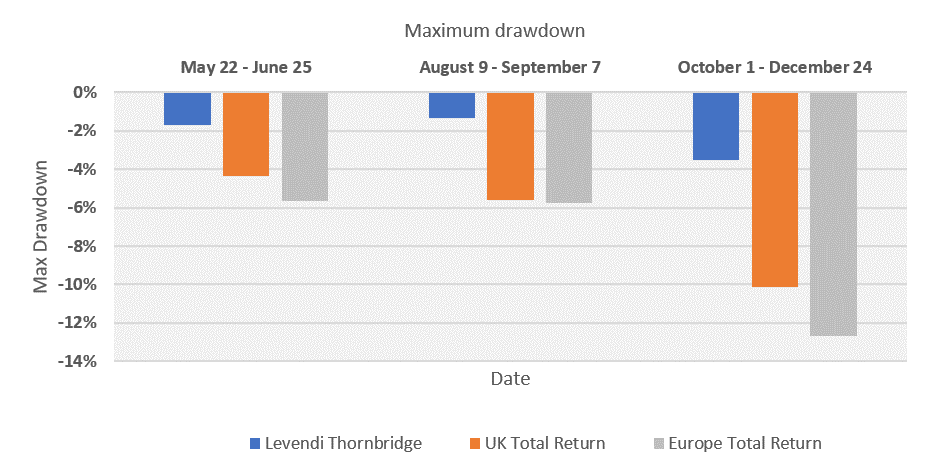
Alternatively, you may view risk as losing money. The below shows our maximum drawdown in the market falls throughout our first year.
The risk return story of the Fund is compelling. It looks even more compelling when compared to the bleak outlook on equities and bonds while “alternatives” have broadly failed to deliver judging by the 1.6% returns from the AH Global Index over the last year.
In this environment a fund like ours looks appealing
- The drivers of return are real and persistent. There are regulatory, structural, economic and behavioural factors behind the Equity Insurance premium (the elevated premium for equity market protection)
- We can generate positive returns that do not rely on rising markets or falling yields
- The conditions where we generate a return are clear and obvious
- There is significant protection before we don’t get a return (markets must fall more than 40% in 8 years)
- There is more protection before capital is at risk (markets must fall more than 50% in 8 years)
- Assets are liquid
- Risks are clear, transparent, measurable and can be managed
- We have a risk management process to control volatility and reduce drawdowns
