The Levendi Fund’s products produced discernible Alpha
REDUCED DRAWDOWN
One of the investment objectives of the Levendi Thornbridge Defined Return Fund (the Fund) is to reduce both the chance and scale of losses. Figure 1 shows the rolling Drawdown of the Fund, the FTSE100 and Eurostoxx50 Total Return indices. This chart shows that markets are starting to catch up with their all-time highs after losing more than 14% of value. By comparison the Funds biggest drawdown was shy of 4%.
FIGURE 1; DRAWDOWN ANALYSIS
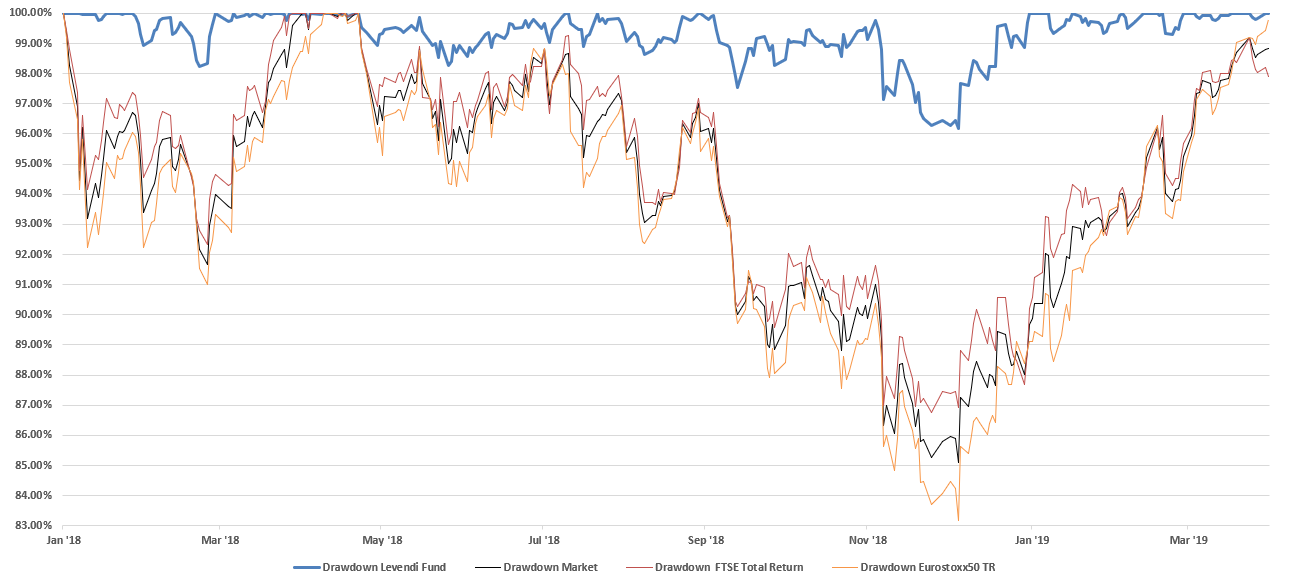
Source; Bloomberg / Levendi Investment Management. Drawdown from All Time Highs for the Levendi Fund against the FTSE and Eurostoxx50 Total Returns, and an equal weight basket of the two indices (“market”)
LOW VOLATILITY
The Fund aims to have volatility between 5% and 7% and uses a risk management overlay to keep volatility below 10%.
FIGURE 2; REALISED VOLATILITY OF THE FUND
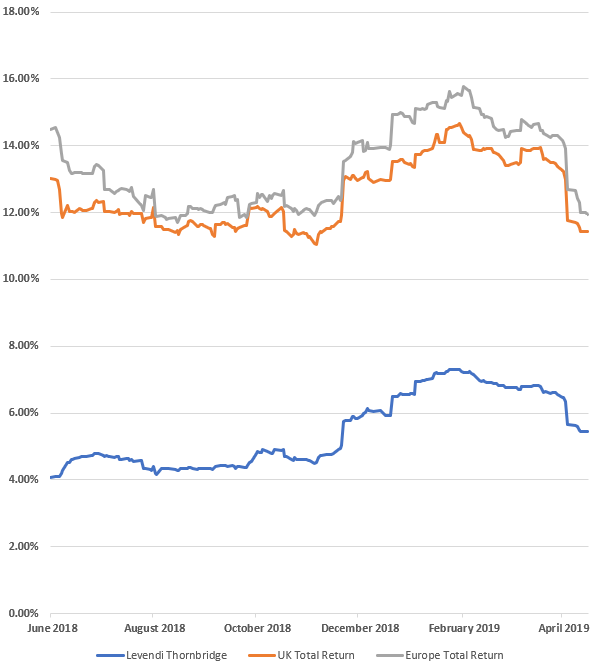
Source; Levendi Investment Management
The Fund recorded a 2019 low in realized annual volatility of 5.3%, which rose during the end of 2018 year due to market volatility but has tapered down since then. Figure 2 above shows how the annualized 90-day Volatility of both FTSE 100 and Eurostoxx50 Total Return Indices have been in the 12%-16% range.
EARLY MATURITY RETURNS EXCEED MARKET RETURNS
The increase in the level of the FTSE and Eurostoxx means that four of our products have matured early during the month of April. The average payoff has been 8.45%. Over the same time periods, the average total return has been +6.36% (i.e including dividends). This means that the investments held by the Fund have generated on average 2.07% more than the Total Return Indices.
Figure 3 shows the spread between the Total Return Market Performance and each product over its investment period.
FIGURE 3; TOTAL RETURN OF UNDERLYING INDICES VERSUS INVESTMENT RETURN
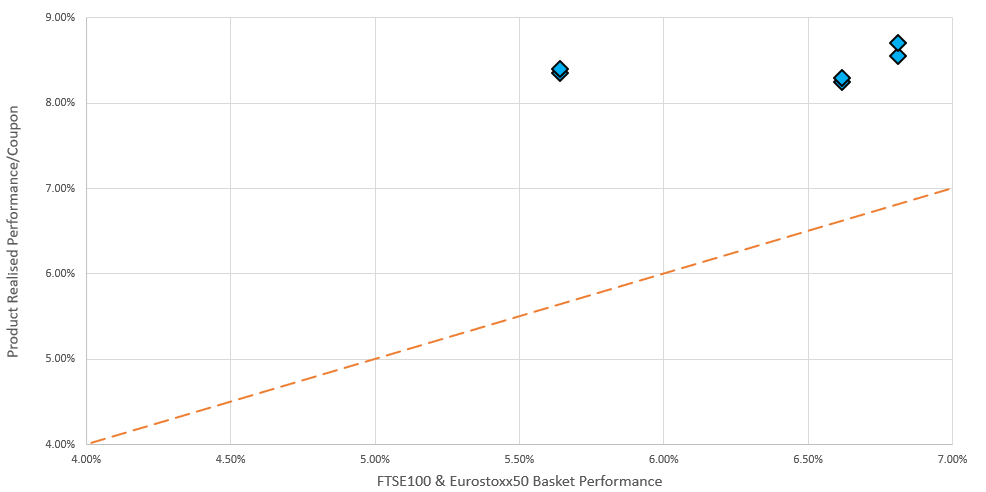
Source; Levendi Investment Management
Figure 4 below shows the payoff of all the products that have matured early so far during the life of the Fund. The chart shows this return versus the Total Return of the FTSE100 and Eurostoxx50 indices. It compares the investment return to the best performing Index in the Basket, as well as the worst performing one. This shows that the return from these investments is comfortably better than the average return and is also better than the best return of the underlying markets.
FIGURE 4; PRODUCT PAYOFF VERSUS BEST, AVERAGE AND WORST RETURN FROM UNDERLYING INDICES
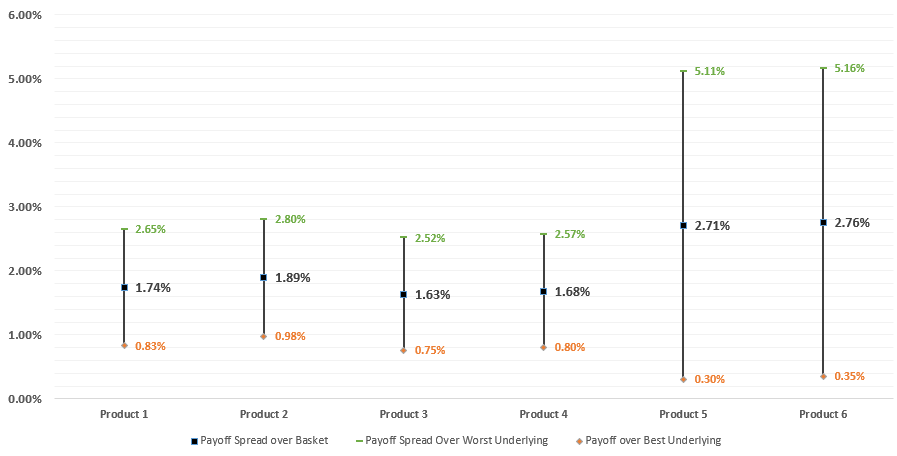
Source; Levendi Investment Management
EVEN SPREAD OF OBSERVATION DATES THROUGH THE YEAR
The early maturity feature of the investments within the portfolio have facilitated the opportunity to reinvest into Gilt-backed products and so increasing the Gilt-Backed investments portion of the Portfolio to closer to the goal of 70%. Gilt-Backed investments reduce the credit risk within the portfolio and any potential losses that could be suffered if an issuer defaults. The Autocall Observation dates within the new investments have been actively diversified to achieve an even portfolio distribution of potential autocall events throughout the year, which in turn, suppresses monthly concentration risk and provides additional diversification.
DISCLAIMER
The contents of this document are communicated by, and the property of, Levendi Investment Management Ltd. Levendi Investment Management Limited Ltd is an appointed representative of Thornbridge Investment Management LLP which is authorised and regulated by the Financial Conduct Authority (“FCA”). The information and opinions contained in this document are subject to updating and verification and may be subject to amendment. No representation, warranty, or undertaking, express or limited, is given as to the accuracy or completeness of the information or opinions contained in this document by Levendi Investment Management Ltd or its directors. No liability is accepted by such persons for the accuracy or completeness of any information or opinions. As such, no reliance may be placed for any purpose on the information and opinions contained in this document. The information contained in this document is strictly confidential. The value of investments and any income generated may go down as well as up and is not guaranteed. Past performance is not necessarily a guide to future performance.
